St. Louis Fed president James Bullard recently gave this speech on the U.S. macroeconomic outlook. The key themes of his talk were:
 This view of the world can lead to a series of embarrassing forecast errors. Since the end of the Great Recession, for example, you would have forecast several recoveries, none of which have materialized.
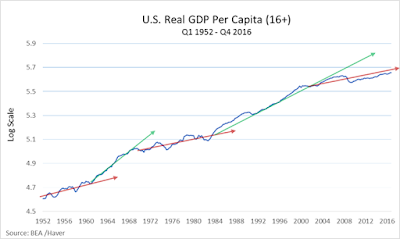
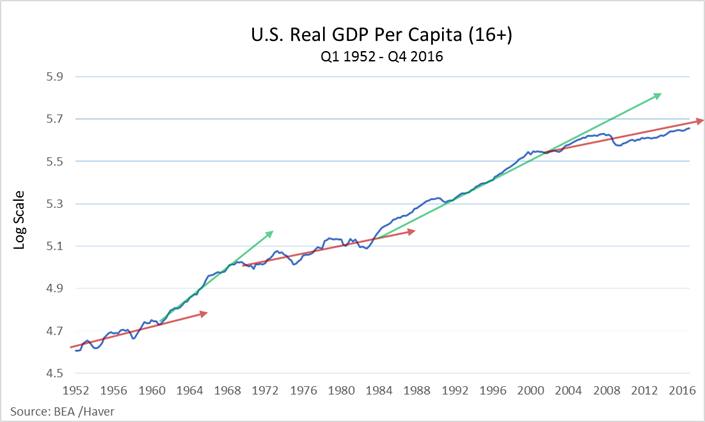
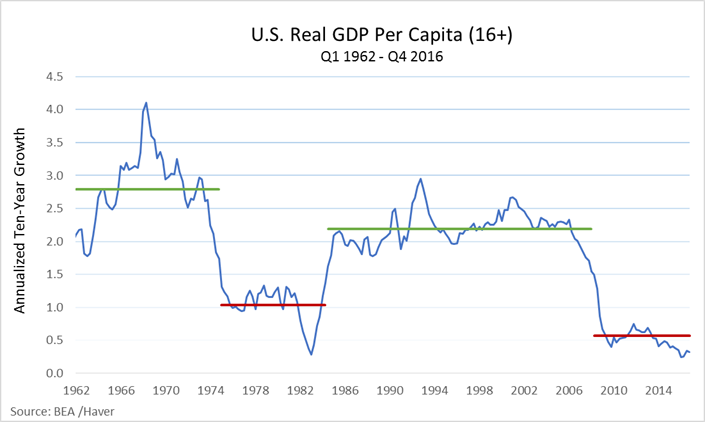
But what if that's not the way growth happens? Suppose instead that growth occurs in decade-long spurts? Something like this.
This view of the development process does not say we're presently stuck forever in a low-growth regime. It simply suggests that we have no idea when the economy will once again embark on a higher (or heaven-forbid, lower) growth regime and that in the meantime our best forecast is for continued low-growth for the foreseeable future.
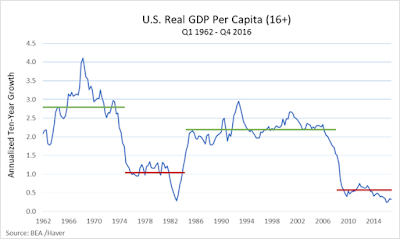
A reader suggests plotting the annualized ten-year growth rate quarter-by-quarter. Here is what it looks like:
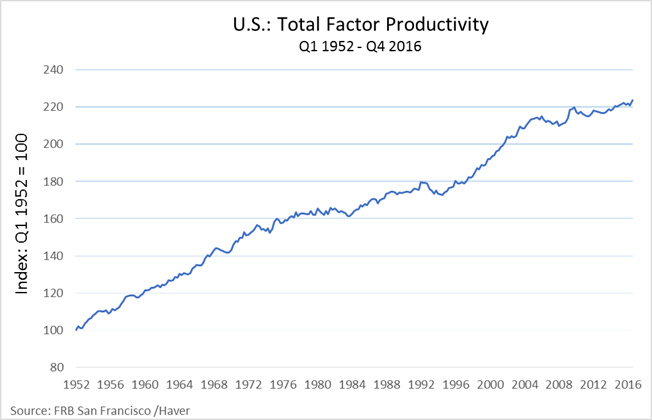
 What determines a growth regime? Government policies may play a role. Or perhaps it's just the way economies grow. There is no God-given rule which says that productivity growth must at all times proceed in a straight line. Here is the San Francisco Fed's measure of total factor productivity:
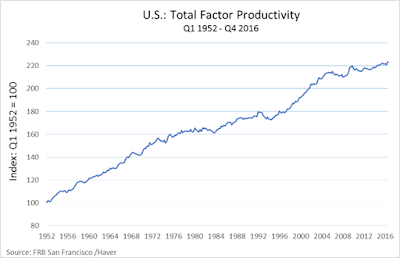 Note that the most recent productivity growth slowdown occurred well before the financial crisis.
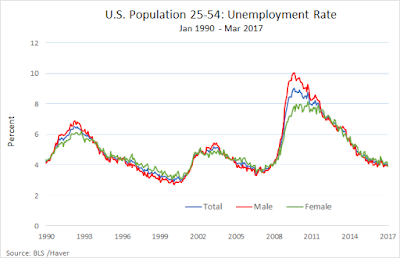
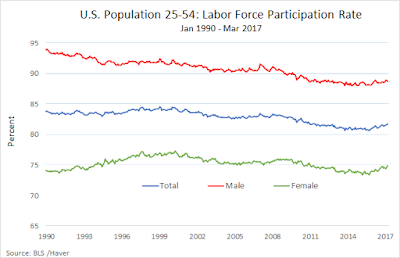
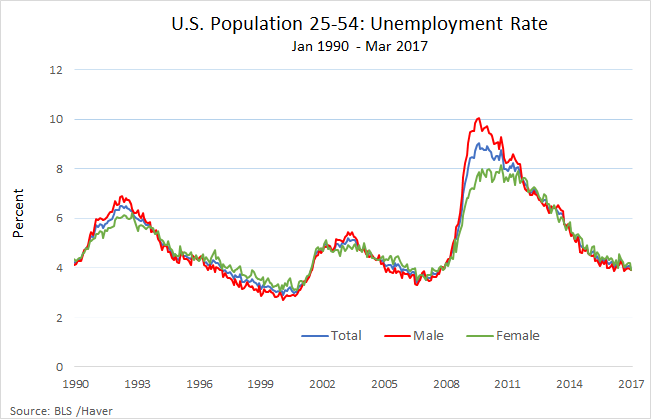
The notion that the economy has converged to a low-growth regime is also evident in a variety of labor market measures. The prime-age unemployment rate is essentially back to its recent historical average, for example.
 Measures of prime-age employment and participation still have a way to go, but arguably not very much.


 Given these observations, what's the rush to raise the policy rate?
At the same time, Bullard is suggesting that it might be a good time to think about reducing the size of the Fed's balance sheet. He notes that recent FOMC policy is putting upward pressure at the short end of the yield curve (via recent policy rate increases) at the same time putting downward pressure at the long end of the yield curve (via the long-term securities purchased in the LSAP). Bullard notes that "this type of twist operation does not appear to have theoretical basis." In fact, it's not clear what policy should aim for (if anything at all) in terms of influencing the slope of the yield curve.
Nevertheless, there are some good reasons to shrink the balance sheet (I provide a reason for keeping it large here). First, if there is indeed a shortage of safe assets, why is the Fed buying them up (replacing them with reserves that only depository institutions can access directly)? Ending the reinvestment program would release additional safe assets for the market, the effect of which would be to increase yields on safe assets (a good thing to the extent higher yields represent diminished liquidity premia.) Second, ending reinvestment (especially in MBS) would be a good move politically. One concern about ending reinvestment seems centered around the possibility of creating another "taper tantrum" event. But it seems unlikely that disruption in the bond market would occur if the policy change is communicated clearly and with plenty of advance notice.
- The U.S. economy has converged to a low-growth, low-safe-real-interest-rate regime, a situation that is unlikely to change dramatically over the near future;
- The Fed can afford to take a wait-and-see posture in regard to possible changes in U.S. fiscal and regulatory policies;
- The U.S. policy rate can remain relatively low for now and that doing so is consistent with the dual mandate;
- Now may be a good time for the FOMC to consider allowing the balance sheet to shrink in nominal terms.

But what if that's not the way growth happens? Suppose instead that growth occurs in decade-long spurts? Something like this.
A reader suggests plotting the annualized ten-year growth rate quarter-by-quarter. Here is what it looks like:
The notion that the economy has converged to a low-growth regime is also evident in a variety of labor market measures. The prime-age unemployment rate is essentially back to its recent historical average, for example.


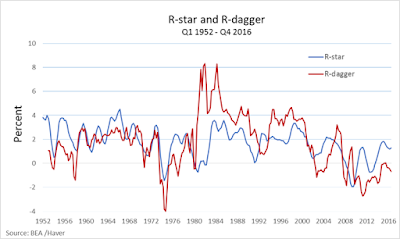
Next, what does he have in mind when he speaks of a "low-safe-real-interest-rate regime?" Bullard associates the "safe-real-interest-rate" with the expected real rate of return on (nominally) safe U.S. treasury debt (which he labels "r-dagger"). Operationally, he uses the one-year U.S. treasury yield minus a measure of year-over-year inflation (e.g., the Dallas trimmed-mean inflation). Below I plot "r-dagger" using year-over-year PCE inflation. I also plot an hypothetical "r-star" interest rate which (as suggested by theory) should track the expected growth rate of real per capita consumption expenditure.

The (theoretical) real interest rate (as measured here by consumption growth)--the blue line--is on average high in high-growth regimes and low in low-growth regimes (the 1950s provide an exception). The r-dagger interest rate appears to move broadly with r-star (the early 1980s provide a dramatic exception). The gap between r-star and r-dagger could be interpreted as a risk-premium (or a liquidity premium). The secular decline in r-dagger since the early 1980s reflects a number of factors. Inflation expectations fell and became anchored under Volcker. And since at least 2000, there's been an ever-expanding global demand for safe assets which are used extensively as collateral in shadow banking, as safe stores of wealth in emerging economies, and as objects that fulfill growing regulatory requirements (Dodd-Frank and Basel III). Evidently, Bullard does not believe that the appetite for these safe assets is likely to dissipate any time soon.
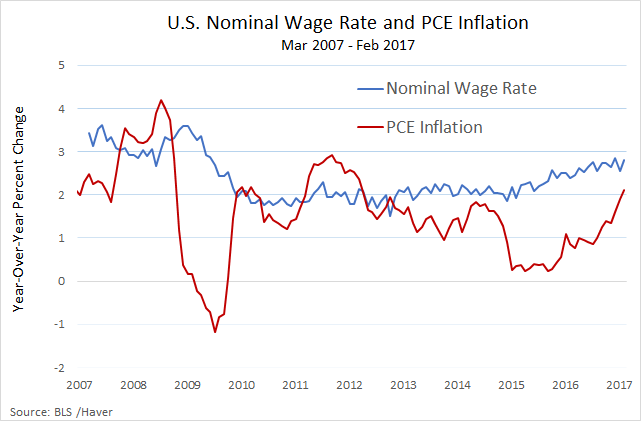
As for inflation, headline PCE inflation has only recently ticked back up close to the Fed's official 2% target. Nominal wage growth has also ticked up recently, but remains rather muted. The growth in real wages remains low--which is consistent with the U.S. economy operating in a low-growth regime.
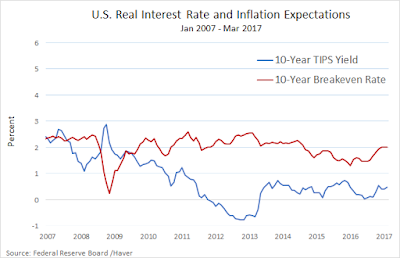
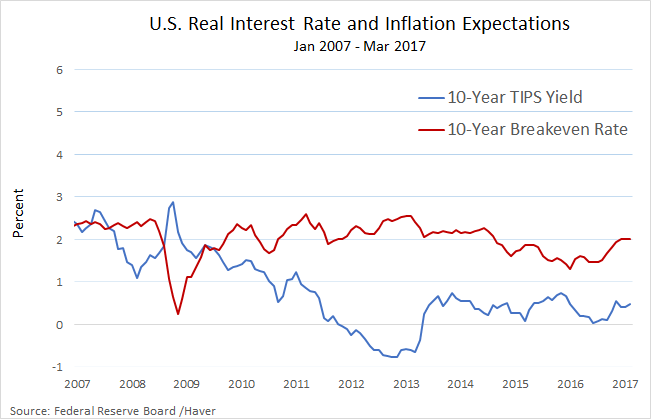
Market-based measures of long-run inflation expectations appear well-anchored. Below I plot the 10-year breakeven inflation rate (expected inflation 10 years out) and the real yield on the 10-year U.S. treasury (blue line).
At the same time, Bullard is suggesting that it might be a good time to think about reducing the size of the Fed's balance sheet. He notes that recent FOMC policy is putting upward pressure at the short end of the yield curve (via recent policy rate increases) at the same time putting downward pressure at the long end of the yield curve (via the long-term securities purchased in the LSAP). Bullard notes that "this type of twist operation does not appear to have theoretical basis." In fact, it's not clear what policy should aim for (if anything at all) in terms of influencing the slope of the yield curve.
Nevertheless, there are some good reasons to shrink the balance sheet (I provide a reason for keeping it large here). First, if there is indeed a shortage of safe assets, why is the Fed buying them up (replacing them with reserves that only depository institutions can access directly)? Ending the reinvestment program would release additional safe assets for the market, the effect of which would be to increase yields on safe assets (a good thing to the extent higher yields represent diminished liquidity premia.) Second, ending reinvestment (especially in MBS) would be a good move politically. One concern about ending reinvestment seems centered around the possibility of creating another "taper tantrum" event. But it seems unlikely that disruption in the bond market would occur if the policy change is communicated clearly and with plenty of advance notice.
I think of the large balance sheet as the Fed acting as a buyer of last resort, holding assets that others don't want - perhaps due to the regulatory constraints that apply to institutions other than the central bank. For example: it is not subject to capital constraints, and can buy as many MBS as it wants.
ReplyDeleteYou are right that reserves are only useful to banks within the regulated system. But for them, reserves are *very* useful because of the way the risk-weighting system treats them. If a bank sells MBS to the central bank in exchange for reserves, this frees up some regulatory capital that can be used to make new loans. In bad times, this pipeline of lending against real estate and selling to the central bank is a way to keep NGDP moving along a desired path.
Another way to think of it is that large holdings of central bank reserves are a way to accommodate a large demand for deposits within the regulated system when banks don't have better options available for creating money.
Small point, David: Maybe the ten-year growth-spurt chart would look interesting if you plotted annualized ten-year growth quarter-by-quarter. Forgive me for not showing an example; it's not laziness; my work computer makes it hard...
ReplyDeleteHi CW, I had my RA construct the series you suggested. It looks quite dramatic. Thanks for suggesting (I will post it).
DeleteWow; that's wild. I've got to think on that image. Thank you!
DeleteI wonder if this is partly a baby boomer issue. The per capita slowdown in the 1970s happened when there was a surge of young adults starting out in the labor market, lowering average productivity. The recent slowdown has happened as boomers leave the labor force.
ReplyDeleteI'm trying to understand the first point of the last paragraph - that selling treasuries increases the stock of safe assets. It seems to imply that reserves at the Fed shouldn't be counted in the stock of safe assets. I understand that only banks can hold reserves and that treasuries are useful to other financial intermediaries. Still, for every dollar of treasuries the Fed sells, at least a dollar of deposits disappears, right? Is the point that deposits are not considered safe assets?
ReplyDeleteGreat question. The label "safe" is a bit misleading in this context. Perhaps "liquid" might be a better term. It may seems strange to think of treasuries being more liquid than reserves, but in a sense they are. In particular, treasuries can be held (and effectively used as money) by non-depository institutions.
DeleteThanks for the reply. I'm still missing something. Suppose a non-depository institution buys bonds from the Fed. Now that non-depository institution has more treasuries and fewer deposits. Are deposits not considered safe and liquid assets?
DeleteUnlike reserves, U.S. treasury debt can circulate outside the banking system. It is used widely as collateral in repo and can be rehypothecated.
DeleteI'm looking at that third graph ("the annualized ten-year growth rate"), in particular the 1970s. You write, "What determines a growth regime? Government policies may play a role..." I agree.
ReplyDeleteEach of the slumps — 1969-70, 1973-75, and the double-dip slump from 1979 to 1982 — were caused, basically, by high interest rates imposed by the Fed to control inflation.
The "quite dramatic" "slowdown in the 1970s" visible in that third graph follows from the high density of recessions in those inflationary years. Compared to the 1960s, in the 1970s there were about twice as many months of recession per year. That pushes the annualized ten-year growth rate down.
Growth during the growth phase of business cycles in the 1970s was about as good as growth in the growth phase of the cycle in the 1960s. But there was less time for growth-phase growth in the 1970s because of all those policy-induced recessions.
As you point out, the case for leaning is not yet strong. It seems that rate increases have in part gained favor within the FOMC as a means to guard against (or appear to guard against) financial system instability, despite the convention favoring macroprudential policy for this purpose. Alternatively, perhaps all FOMC members have converted to Neo-Fisherism.
ReplyDeleteYou might want to look at this recent paper published on REStat. Quite supportive of the low growth regime argument:
ReplyDeleteJuan Antolin-Diaz & Thomas Drechsel & Ivan Petrella, 2017. "Tracking the Slowdown in Long-Run GDP Growth," The Review of Economics and Statistics, MIT Press, vol. 99(2), pages 343-356, May.